Friday, October 19, 2018

SEG 2018 Trip Report

Notice: 2018 SEG Abstracts are online till 22 Oct. After that, they will only be available to SEG members.

Saturday 10/13

Started with an early drive to Dana Point, a lovely seaside town. The waves were up and it was drizzling, but still beautiful. Breakfast at RJ's Cafe which I highly recommend, but it is busy so get there early or expect to wait in line. Back in Pasadena I ran across a Shakey's Pizza Parlor that brought back fond memories of the 1960s in Tulsa when the young Liner family used to go to Shakey's. Later, wandered to The Cave, a local watering hole, with friends Kyle Spikes and Jeff Shragge then finished off the day with a solo Sushi dinner at the Tokyo Love Japanese Restaurant.

Sunday

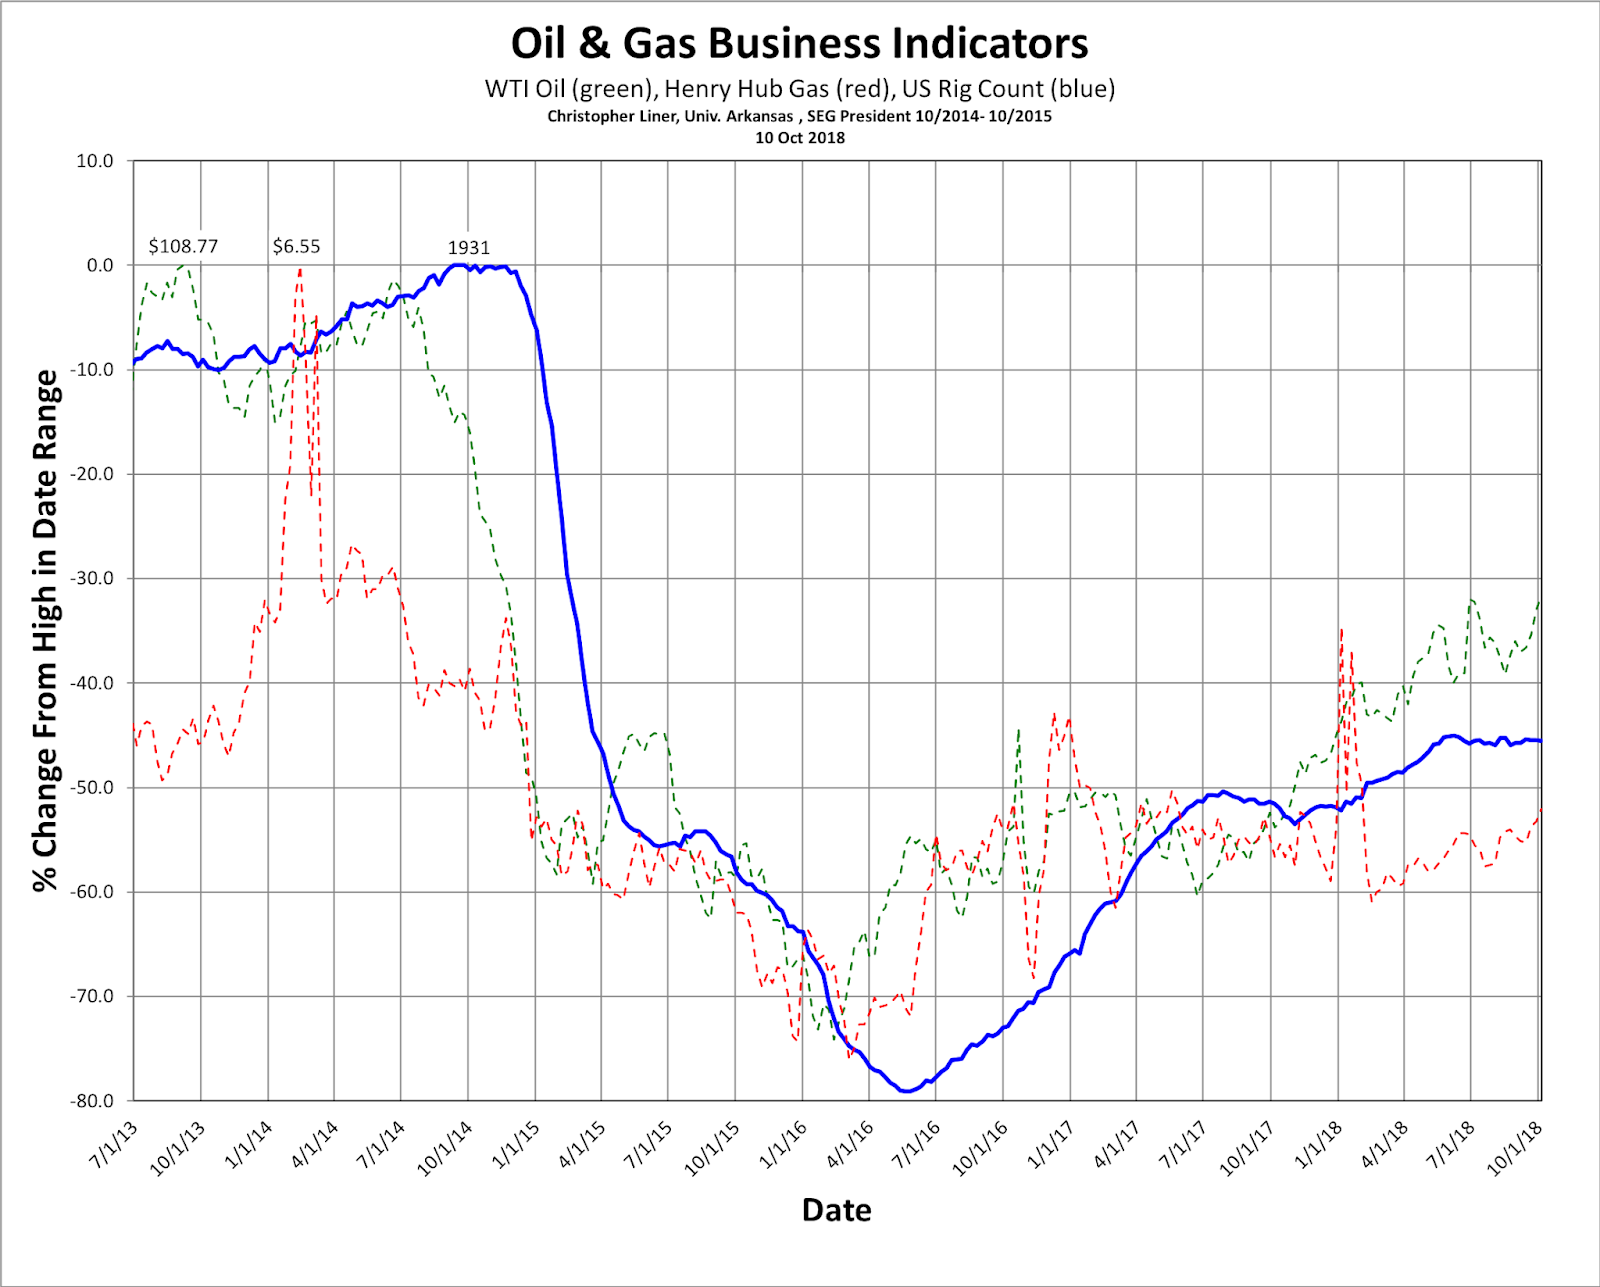
Attended the SEG Council Meeting. Nancy House presidential address showed SEG finances recovering nicely from the crash of 2015. The big news was an SEG Bylaws change that was approved on split vote. SEG trivia: a motion before the Council requires a 2/3 majority vote to pass, assuming a quorum of 1/3 of all members has been established, meaning that 2/3rds of 1/3rd, or 22%, of the Council is the minimum number of votes needed to pass a motion. The motion in question here was to allow Associate Members to vote in SEG elections, a right currently reserved for Active Members. For information on membership categories, see the SEG Bylaws Article III, Section 1. For the new rule to become the law of the land, the motion must be posted in The Leading Edge and then voted on by the Active SEG Members. In effect, the Active Members will be asked to dilute their own voting power, since the SEG membership composition is about 38% Active, 32% Associate and 29% Student (2015 numbers). The Associate Member group is generally younger and more diverse than the Active group. Some of the Actives will want to do this, some won't, that is why we take the vote.

At the icebreaker a strong crowd appeared in good spirits. I spent most of the time at the Fairfield Technologies booth with friends John Smythe and Paul Docherty. Liner trivia: I worked for Fairfield in 1989 when they were still Golden Geophysical. The icebreaker buzz was in two areas (1) the Houston Astros playoff game and (2) machine learning, meaning artificial intelligence and neural networks.

Before the meeting I was expecting the buzz to be full waveform inversion (FWI), distributed acoustic sensing (DAS) or, maybe, drone geophysics. These are all game changers. FWI is advancing steadily with computer power, particularly graphics processing unit (GPU) clusters, and algorithm development. When it works, the result is a subsurface velocity model of amazing clarity and detail, almost ready for interpretation in its own right away from the data that generated it. DAS is revolutionizing some kinds of seismic acquisition by doing away with discrete sensors and replacing it with a continuous DAS cable. Drone geophysics is a big deal in shallow studies. Various kinds of sensors enable quick, detailed mapping. Drones are also used for deployment of some seismic survey elements.

Despite all that, machine learning (ML) was the mega-buzz at SEG before one talk was given. Before diving into what ML is, let me say what it used to be. When I went to Colorado School of Mines (CSM) in the mid-1980s, there was an artificial intelligence (AI) project underway in geophysics. The goal was to develop an 'expert system' by coding up all the decision knowledge of a subject expert in a bewildering array of IF-THEN-ELSE kind of statements in the Lisp programming language. Some progress was made, I suppose, but this kind of expert system is not the main branch of ML history. The early story of ML is the early history of neural networks (NN) that can be found on many sites (e.g., Stanford). In SEG Abstracts literature, the first with 'neural network' in the title was Minimum-variance deconvolution using artificial neural networks (Zhao and Mendel, 1988). Fittingly, they were from USC which is not far from Anaheim where the 2018 SEG meeting was held.  The first TLE article was Waveform recognition using neural networks (Palaz and Weger, 1990) and for Geophysics it was Adaptive minimum prediction-error deconvolution and source wavelet estimation using Hopfield neural networks (Wang and Mendel, 1992). Heady stuff and a far cry from the ML that was buzzing at the 2018 SEG where a kind of ML was being touted that is within technological reach of anyone and applies to the interpretation of data.

The terms used in this revolution can be confusing. Machine learning (ML) seems to be the most general term, with neural network (NN) being a specific approach to and subset of ML, and artificial intelligence (AI) out there in broader culture. To my taste, ML is the better term. 'Artificial intelligence' pulls along with it all the concepts related to human intelligence, such as rationality, consciousness, self awareness. All are misleading and unwelcome distractions from the actual technology status today. To my taste, ML is the preferred term. From the Google Trends five-year data below, it looks like I am not the only one.


Monday

The opening ceremony was very well attended, standing room only. The leadoff speakers were General Chair Dan Hollis (nice job!) and SEG President Nancy House, but the main speaker was Darryl Willis, VP of oil, Gas and Energy at Google Cloud. Excellent speaker with strong petroleum industry experience,  he has been seven months with Google and the new group has 25 employees, likely to be near 100 in early 2019. The team is composed of energy professionals (geology, geophysics, engineers, etc.) to focus and drive Google to significant problems that machine learning can tackle.  (Could Google have more geophysicists than a mid-size oil company by 2019?) Willis gave a vigorous pep talk insisting that progress in the energy sector is not coming fast enough. The only example given was reduction of timeline for seismic acquisition/processing/interpretation from five to one-and-one-half years (I think). An interactive session followed with written questions from the audience. In response to "How does someone get started?" Willis recommended the book Machine Platform Crowd ... which I ordered on my phone two minutes after he mentioned it. The ultimate instant gratification. The question I wrote but did not submit: "Should intelligence, artificial or otherwise, be proprietary?"

Lunch with John Stockwell, recently retired out of CSM but still teaching seismic data processing. After lunch I went to Art Weglein's talk (abstract) about multiples, but really about migration and high frequency (HF) approximations. He explained that migration has two parts (1) wave field simulation and (2) imaging condition. The HF approximation is limiting and can be in either (1) or (2); even reverse time migration (RTM) using the full wave equation for simulation can be a high frequency method if the imaging condition is HF. Art discussed three classic imaging conditions two of which are HF and one that is not.

Later, on the exhibit floor I got much-needed help at the GeoTeric booth from Geosciences Manager Rachael Moore. Even in the age of machine learning, loading SEGY data can be a challenge; I had been unable to load SEGY on my own at U Arkansas using an academic GeoTeric license  (thank you!). GeoTeric has a great import tool and interface, but I needed to have someone walk me through it one time. Big shout out to Rachael for her invaluable help.

Maarten de Hoop's paper Deep neural-network architectures arising in seismic-inverse problems packed a big room. One section of the talk caught my attention: Maarten described building a deep neural network. (The term 'deep' is a code word among practitioners for a NN with more than one hidden layer. If you really want to drill down in ML, see the course notes for this Carnegie Mellon class) After constructing his NN, Maarten applied it to data from a seismic station near a place where a landslide occurred. He had some data before, during, and after the landslide. Applying his NN, he found (asked for?) three classifications that you might call 'background state', 'landslide event', and everything else. It is the everything else that is interesting. This class began to show up well ahead of the landslide with increasing insistency as the landslide time approached. The amazing things about this are (1) the precursor class cannot be seen in the raw data, (2) the NN picked out the precursor class with no knowledge of landslide or seismic physics, (3) the trained NN could immediately be applied to areas with potential landslide hazard as an early warning system. Of course, people who study landslides have many kinds of non-seismic data, such as strain meter output, satellite or GPS ground motion, and even ground water sampling. Neural nets are marvels at working with big, diverse data sets. Presumably, Maarten's NN prediction would benefit from stuffing in all these data.

It is interesting to contemplate the roles of the human and machine in machine learning. Currently the human roles are (1) posing the problem and writing the NN code, (2) preparing data for input to the NN, (3) training the NN, and (4) interpreting the NN output. The threat that concerns those who think about such things is automation of item (1), that would mean machines that are 'smart' enough to write ever-improving ML algorithms better than humans and we begin along a very dangerous path. For now, that is science fiction. But the other human roles will be growth areas in the ML age. The interpretation of ML output, is intriguing. In Maarten's example, the NN provide the three classes, but he (a human) studied the output and realized the precursor was in there. So maybe ML will not so much replace human interpreters as move them to a new level. Like a microscope or any other investigation tool, ML provides new kind of information that someone has to interpret to find meaning. But those lofty, new-world keepers and interpreters of ML may be few compared to the legions of raw data interpreters we have now.

Next it was on to the Repro Zoo with Matt Hall of Agile Blog fame. The idea of Repro Zoo is get coders and wanna-be coders together and hack together a few figures from classic papers as little steps toward reproducible research. I was flattered to see my elastic attenuation (negative Q) paper was on the list. On this day, I was back seat driver for Matt on a figure from Connelly's 1999 classic elastic impedance paper. You can find the results of the Repro Zoo on GitHub.  While at the zoo, I met with my PhD student Lanrè Aboaba to review his slides for our Wednesday talk 3D Seismic interpretation of Paleozoic karst features in the Arkoma Basin of Oklahoma.

Later in the evening was the always fabulous Editor's Reception and awards. Valentina Socco is finishing up her term as Geophysics Editor and has done an outstanding job. Her successor is yet to be officially named. When Sven Treitel became Geophysics Editor in 1995, there was one Assistant Editor (Larry Lines), a number Associate Editors, and since time immemorial the Editor was expected to review every paper. Sven added a second Assistant Editor (me) and pointed out that even if he could find time to review every paper, he should not do so because no one is an expert in all areas of geophysics. Now there are seven Assistant Editors. I am told there is even a double-blind review system in place to minimize bias of various kinds from the peer review process. I suggested this in my term as Editor (1999-2001), but it was soundly rejected. Maybe I should have pressed the issue a bit harder. Glad to see it finally happened.

Tuesday

Went to Tom Smith's Geophysical Insights booth for a Rocky Roden talk on machine learning. If anyone can explain ML in a way that I can understand, Rocky is the guy. I was not disappointed; it was a  overview with examples of application to interpretation. Tom saw the ML wave coming a few years ago and has created a fine product called Paradise.

After a chat about SEG politics with Lee Bell, we lunched with Larry Morely. Very nice to catch up. I also bumped into Gerard Wiggerink of EAGE on the exhibit floor, a Seismos Blog follower and good friend. I must say, that Gerard wins the best-dressed award with a blue suit and matching shoe laces.

The last thing I managed to do at the convention was to seek help at the DownUnder Geosciences (DUG) booth to get some help, yes, loading SEGY data. The very capable Russell Holroyd who wrestled my data into DUG Insight then gave me a quick overview of the interface and capabilities. DIG Insight is another product that may help with research projects and course development back at the U of Arkansas. Thank you Russell and DUG for the great help.

During the exhibit floor refreshment hour, John Stockwell and I chatted comparing notes on talks and concepts seen at the meeting. In a philosophical moment, I asked him "If I hit a neural network with a hammer does it feel pain?" His reply, "No, but you might - if you were fond of it."

The last event of my 2018 SEG meeting was the President's Reception and Awards Ceremony. The award winners for this year can be found here. A highlight of the evening was the Maurice Ewing Medal awarded posthumously to Albert Tarantola who passed in 2009. Albert's work in the 1980's laid the the foundation for full waveform inversion (FWI). Later advances in algorithms and computer power have made FWI a reality and it is only fitting that today's SEG should honor this remarkable pioneering scientist.


Wednesday, October 10, 2018

Oil Crash of 2015 - ? ... Update

Now into the fourth year. Is it still a crash or the 'new normal'? One thing for sure, the geoscience job market has recovered even less than rigs or commodity prices. A generational downdraft.


Saturday, August 25, 2018

Springer Book

I am working on a new book to be published by Springer in their Springer Briefs series. The topic is the role of seismic interpretation in hydrocarbon exploration and production. My co-Author is Thomas 'Mac' McGilvery, a long time friend who recently retired out of ConocoPhillips after serving several years as a global stratigraphy guru. Just thought I would put out a nice figure that may make it into the book.


Thursday, August 23, 2018

Giant Cephalopod

When our building was recently rennovated (Ozark Hall then, Gearhart Hall now) all Geoscience hallway displays were removed and are slowly moving back in place. This week was a milestone with return of our giant Cephalopod, a local fossil of Mississippian (Chester) age. Welcome home.


Friday, June 1, 2018

Why am I a vegetarian?

This question comes up all the time.  Being raised in BBQ country of Arkansas, I never met a vegetarian growing up and, like all kids, I fell into doing just what my parents and friends did: eat meat and lots of it. 

But part of growing up is rethinking the ways of our parents, making reasoned decisions on how we want to live our lives. In the late 1990s I met Dolores Proubasta, then Assistant Editor of SEG's Leading Edge magazine and a vegetarian. My thinking on this subject lead to an understanding that meat was fundamentally cruel and unnecessary for nutrition. In August 1998 at an SEG Board meeting in Kananaskis near Calgary, I stood in line for the BBQ and made the decision not to eat meat that day, and have not eaten it any day since. So in August 2018, I will have been an ethical vegetarian for 20 years.

I recall, however, meeting a family of climate vegetarians a few years ago and it took me a while to understand what this is about. Since then, I have done some deep study on greenhouse gasses and animal agriculture. But it turns out (see article below from today's Guardian newspaper) that animal agriculture is an assault not just on climate, but land use and biodiversity.

The food animal industry is unimaginably cruel. Very little has changed since Upton Sinclair's The Jungle was written in 1906, except the accelerating application of perverted science to the design, rearing and killing of food animals. I am still comfortable as an ethical vegetarian, but the new study reported below makes the case for much broader concerns.

Einstein said it best: Nothing will benefit health or increase chances of survival on earth as much as the evolution to a vegetarian diet.

------------------


Avoiding meat and dairy is ‘single biggest way’ to reduce your impact on Earth

Biggest analysis to date reveals huge footprint of livestock - it provides just 18% of calories but takes up 83% of farmland

Avoiding meat and dairy products is the single biggest way to reduce your environmental impact on the planet, according to the scientists behind the most comprehensive analysis to date of the damage farming does to the planet.

The new research shows that without meat and dairy consumption, global farmland use could be reduced by more than 75% – an area equivalent to the US, China, European Union and Australia combined – and still feed the world. Loss of wild areas to agriculture is the leading cause of the current mass extinction of wildlife.

The new analysis shows that while meat and dairy provide just 18% of calories and 37% of protein, it uses the vast majority – 83% – of farmland and produces 60% of agriculture’s greenhouse gas emissions. Other recent research shows 86% of all land mammals are now livestock or humans. The scientists also found that even the very lowest impact meat and dairy products still cause much more environmental harm than the least sustainable vegetable and cereal growing.


The study, published in the journal Science, created a huge dataset based on almost 40,000 farms in 119 countries and covering 40 food products that represent 90% of all that is eaten. It assessed the full impact of these foods, from farm to fork, on land use, climate change emissions, freshwater use and water pollution (eutrophication) and air pollution (acidification).

“A vegan diet is probably the single biggest way to reduce your impact on planet Earth, not just greenhouse gases, but global acidification, eutrophication, land use and water use,” said Joseph Poore, at the University of Oxford, UK, who led the research. “It is far bigger than cutting down on your flights or buying an electric car,” he said, as these only cut greenhouse gas emissions.
“Agriculture is a sector that spans all the multitude of environmental problems,” he said. “Really it is animal products that are responsible for so much of this. Avoiding consumption of animal products delivers far better environmental benefits than trying to purchase sustainable meat and dairy.”
The analysis also revealed a huge variability between different ways of producing the same food. For example, beef cattle raised on deforested land result in 12 times more greenhouse gases and use 50 times more land than those grazing rich natural pasture. But the comparison of beef with plant protein such as peas is stark, with even the lowest impact beef responsible for six times more greenhouse gases and 36 times more land. 


The large variability in environmental impact from different farms does present an opportunity for reducing the harm, Poore said, without needing the global population to become vegan. If the most harmful half of meat and dairy production was replaced by plant-based food, this still delivers about two-thirds of the benefits of getting rid of all meat and dairy production.

Cutting the environmental impact of farming is not easy, Poore warned: “There are over 570m farms all of which need slightly different ways to reduce their impact. It is an [environmental] challenge like no other sector of the economy.” But he said at least $500bn is spent every year on agricultural subsidies, and probably much more: “There is a lot of money there to do something really good with.” 

Labels that reveal the impact of products would be a good start, so consumers could choose the least damaging options, he said, but subsidies for sustainable and healthy foods and taxes on meat and dairy will probably also be necessary. 

One surprise from the work was the large impact of freshwater fish farming, which provides two-thirds of such fish in Asia and 96% in Europe, and was thought to be relatively environmentally friendly. “You get all these fish depositing excreta and unconsumed feed down to the bottom of the pond, where there is barely any oxygen, making it the perfect environment for methane production,” a potent greenhouse gas, Poore said.

The research also found grass-fed beef, thought to be relatively low impact, was still responsible for much higher impacts than plant-based food. “Converting grass into [meat] is like converting coal to energy. It comes with an immense cost in emissions,” Poore said.

The new research has received strong praise from other food experts. Prof Gidon Eshel, at Bard College, US, said: “I was awestruck. It is really important, sound, ambitious, revealing and beautifully done.” 

He said previous work on quantifying farming’s impacts, including his own, had taken a top-down approach using national level data, but the new work used a bottom-up approach, with farm-by-farm data. “It is very reassuring to see they yield essentially the same results. But the new work has very many important details that are profoundly revealing.”

Prof Tim Benton, at the University of Leeds, UK, said: “This is an immensely useful study. It brings together a huge amount of data and that makes its conclusions much more robust. The way we produce food, consume and waste food is unsustainable from a planetary perspective. Given the global obesity crisis, changing diets – eating less livestock produce and more vegetables and fruit – has the potential to make both us and the planet healthier.”

Dr Peter Alexander, at the University of Edinburgh, UK, was also impressed but noted: “There may be environmental benefits, eg for biodiversity, from sustainably managed grazing and increasing animal product consumption may improve nutrition for some of the poorest globally. My personal opinion is we should interpret these results not as the need to become vegan overnight, but rather to moderate our [meat] consumption.”

Poore said: “The reason I started this project was to understand if there were sustainable animal producers out there. But I have stopped consuming animal products over the last four years of this project. These impacts are not necessary to sustain our current way of life. The question is how much can we reduce them and the answer is a lot.”

Wednesday, May 16, 2018

AAPG Annual Meeting 2018

Presentations (speaker underlined):

Monday, 10:50-11:10 am, Ballroom A
Seismic Characterization of Natural Fractures in the Buda Limestone of Zavala County, Texas 
A. Smirnov and C.L. Liner


The Buda Limestone is a naturally fractured Early Cretaceous carbonate formation in south Texas which is unconformably overlain by the Eagle Ford Shale. Matrix porosity of the Buda is less than 6%, therefore natural fractures improve the potential for commercial hydrocarbon production from this tight limestone formation. It is a challenge for producers to identify these zones using well log and poststack 3D seismic data which typically available to medium or small exploration companies. This project provides a workflow based on well log analysis tied to seismic acoustic impedance (AI) inversion to locate areas of probable natural fractures.

Acoustic impedance inversion was performed across a 40 square mile 3D seismic survey. The AI data shows low impedance shadow zones on the down thrown side of faults. Post stack geometric seismic attributes such as coherence, maximum and minimum curvature were analyzed in the anomalous AI areas, along with physical seismic attributes such as RMS amplitude and instantaneous frequency.

To map primary porosity, a relationship between acoustic impedance and porosity is established by crossplotting well log data. A linear fit to the Buda data in one well indicates a robust correlation between sonic porosity, density-porosity and AI. Sonic porosity is an indicator of the matrix porosity in the Buda Limestone, while density porosity represents both matrix and fracture porosity. Using the trend line equation for AI vs sonic porosity, the 3D seismic impedance volume was scaled to a matrix porosity volume.

In the downthrown faulted areas, the porosity volume indicates values greater than expected of matrix porosity. This has been reported elsewhere in carbonate reservoirs as an indicator of enhanced secondary (fracture) porosity. This study indicates that a combination of acoustic impedance inversion and seismic attributes can identify areas of enhanced natural fracturing within the Buda Limestone interval.

Tuesday, 9am, Exhibit Hall
Mapping Lower Austin Chalk Primary and Secondary Porosity Using Modern 3-D Seismic and Well Log Methods in Zavala County, Texas [poster 77]
D. Kilcoyne and C.L. Liner


Establishing fracture distribution and porosity trends is key to successful well design. The Austin Chalk has historically been referred to as an unpredictable producer due to high fracture concentration and lateral variation in stratigraphy, however recent drilling activity targeting the lower Austin Chalk has been very successful. The Upper Cretaceous Austin Chalk (AC) and Eagle Ford (EF) units are considered by many to act as a single hydrocarbon system so both units are investigated. Communication between these two units is largely through expulsion or dewatering fractures, extensional faults or along the AC/EF unconformity. Total porosity for the Eagle Ford is composed of a primary matrix component and secondary fracture porosity. For the Austin Chalk, the secondary porosity includes both dissolution and fracture components which complicate wireline and seismic interpretation.

The current study interprets 40 square miles of modern 3D seismic data for horizons and faults using amplitude, coherence and ant tracking seismic attributes. Post stack acoustic impedance (AI) inversion is applied to the time migrated seismic volume with control from two wells; this input data is similar to that available to independent operators active in the area. Wireline acoustic impedance plotted against density-porosity reveal strong correlations that allow calibration of seismic AI into primary, secondary and total porosity from which time slices and surface maps are created. Relationships are identified between porosity and geological features of interest, such as faulted and brittle zones, that may prove useful in guiding future well development in the lower Austin Chalk.

Wednesday, 11:10-11:30 am, Ballroom C
Tracks, Outrunner Blocks, and Barrier Scours: 3-D Seismic Interpretation of a Mass Transport Deposit in the Deepwater Taranaki Basin of New Zealand 
F.J. Rusconi, T.A. McGilvery and C.L. Liner


A series of Plio-Pleistocene mass transport deposits (MTD) have been identified in the deepwater Taranaki Basin, in New Zealand, using the Romney 3D seismic survey. One of these MTDs has been chosen for description and interpretation based on high confidence mapping of its boundary surfaces. The deposit exhibits an array of interesting features similar to those documented by researchers elsewhere plus a unique basal feature unlike those previously observed. The basal shear surface exhibits erosional features such as grooves, “monkey fingers”, and glide tracks. We have been able to image outrunner blocks at the end of the glide tracks in distal areas of the deposit. 

Internally, the MTD is typically characterized by low impedance, chaotic, semi-transparent reflectors surrounding isolated coherent packages of seismic facies interpreted as intact blocks rafted within the mass transport complex. These transported blocks scale up to 1 km wide and 200 m high, and commonly protrude above the upper surface of the flow. This yields a very irregular paleo-bathymetric surface on the top of this and other MTDs with local relief attributed these protrusions ranging from 10 m to >100 m . The complexity of this upper surface had local impact on subsequent flows. 

The term “shield block” refers to those large protruding obstacles on the paleo-seafloor that acted as barriers to subsequent flows as they advanced downslope. Obstacles such as mud volcanos have been documented to act as such barriers resulting in elongate, downflow erosional remnants as positive features. The opposite is the case for shield blocks, which disrupt flow and result in elongate, downflow erosional troughs that are negative features. These local erosional features are then infilled similar to mega flutes and are preserved as elongate isochron thicks on the downflow end of the underlying shield block. Kinematic evidence provided by various structures suggests that the MTD flow direction was SE-NW toward bathyal depths. The features presented and the absence of extensional headwall structures, such as local arcuate glide planes and rotated slide blocks, suggests that this part of the deposit belongs to the translational to distal domain of the MTD, and its source area is expected to be somewhere toward the SE in a paleo continental slope.

Wednesday, May 9, 2018

Hime Honors Thesis 2018

Title page of the thesis.
Link to PDF
A short note was posted to LinkedIn: "My first Honors student at the University of Arkansas is Regan Hime. Double major in Geology/Physics and fantastic GPA. Her Honors thesis was on seismic clinoform scaling laws and she will graduate Summa Cum Laude this week". Post analytics show over 7000 views.


Friday, April 27, 2018

Best Prospect 2018

My 3D Seismic Exploration class just wrapped up with the final prospect presentations and voting for the Best Prospect award. The winner as voted by class members is Kyle Rowden and the Ghost Repeater prospect.

We want to thank Schlumberger for donating Petrel software used in the class, and FairfieldNodal for the Gulf of Mexico 3D seismic data interpreted by the students.

Class photo with Best Prospect winner Kyle Rowden (center, left) holding the winner's trophy. Congratulations Kyle! Altogether, a great group of students. As usual, for Dr. Liner it was tye-dye test day.
Ghost Repeater prospect summary slide
The winner trophy, an owl of knowledge from Barcelona.

Bottom inscription immortalizing the 2018 Best Prospect trophy. 

Thursday, March 8, 2018

JMK Liner

The event

The celebration

Saturday, March 3, 2018

Core Workshop by Will Cains (Devon Energy)

Big shout out to Will Cains (Devon Energy) for coming to campus and holding a core workshop for geology students. Will is center right pointing at wireline data plot of the cored interval. The workshop was held on Friday 3 March 2018. Thanks Will!

Another view of the action. Core data from Ft. Worth Basin (Atoka) is on loan from Devon Energy, facilitated by Bill Coffey -- UA geology alumnus and External Advisory Board Chair.

Tuesday, February 6, 2018

Fourier Transform Talk and Python Code

————— 6 Feb 2018 —————

Lecture notes from the Fourier Transform brown bag talk:


————— 5 Feb 2018 —————

Well, it was probably a blur, but we got through a few good ideas. Got this from Max, who organizes the brown-bag lecture series. The video he links is, indeed, excellent. Thanks, Max!

Dr. Liner,
     Thanks again for doing Brown Bag! Sorry it cut short, I had forgotten there was a a lab in their at 1:30 and didn't inform you.
     Also, if you have time you should check out this introduction to Fourier Transforms: https://www.youtube.com/watch?v=spUNpyF58BY . It has a great intuitive visualization, and may be useful for sending to students who are learning FTs!
     Best,
     Max

————— 1 Feb 2018 —————

I'll be giving an improv brown-bag lecture next Monday on campus, here is the flyer.  Should be fun!

Cartoon credit


Fig 1. FFT of 50 Hz sine wave sampled at 1 millisecond (0.001 sec). Lower plot is the Fourier Transform amplitude spectrum.
Fig 2. FFT of 50 Hz square wave showing harmonics. The harmonics arise because the Fourier Transform decomposes the signal into sine and cosine waves that are not a natural fit for square waves. To represent the square wave no singe frequency will suffice, it takes a doubly periodic family of sin-cos waves: each sin-cos is periodic in itself and the harmonics are periodic multiples. In the case shown, the nth harmonic (fn) is related to the fundamental (f0) by the rule: fn = f0*(2n+1) where n=0,1,2,...  Consequently, it is better practice to describe such signals as 50 cycles per second (cps) and reserve the term Hertz (Hz) for smooth signals. In passing, I note that harmonics can also arise from smooth signals if there is amplitude asymetry present, indicating nonlinear processes are at work. For discussion of this case, see Chapter 2 of my DISC book available from SEG or Amazon.
---------------------

Python FFT code, most of it is for pretty plotting.

import numpy as np
import matplotlib.pyplot as plt
import scipy.fftpack
from scipy import signal

# Number of sample points
nt = 1000
# sample spacing (seconds)
dt = 0.001
# make the time vector
t = np.linspace(0.0, nt*dt, nt)
# calculate sine function at each time point
y1 = np.sin(50.0 * 2.0*np.pi*t)
# do the FFT
yf = scipy.fftpack.fft(y1)
# make the frequency vector from zero to Nyquist
xf = np.linspace(0.0, 1.0/(2.0*dt), nt/2)

# plot the sine wave and its Fourier amplitude spectrum
plt.subplot(2,1,1)
plt.plot(t,y1)
plt.subplot(2,1,2)
plt.plot(xf, 2.0/nt * np.abs(yf[0:nt/2]))
plt.grid()
plt.ylim(0,1.5)
plt.title('Fourier Transform of 50 Hz Sine Wave')
plt.xlabel('Frequency (Hz)')
plt.ylabel('Fourier Amplitude')
plt.tight_layout()
plt.show()

# calculate the square wave function at each time point
y2 = signal.square(2 * np.pi * 50 * t)
yf = scipy.fftpack.fft(y2)

# plot the square wave and its Fourier amplitude spectrum
plt.subplot(2,1,1)
plt.plot(t,y2)
plt.subplot(2,1,2)
plt.plot(xf, 2.0/nt * np.abs(yf[0:nt/2]))
plt.grid()
plt.ylim(0,1.5)
plt.title('Fourier Transform of 50 Hz Square Wave')
plt.xlabel('Frequency (Hz)')
plt.ylabel('Fourier Amplitude')
plt.tight_layout()
plt.show()

Fig 3. The code above can be used to visualize the concept of aliasing. The Nyqvist frequency, Fn=1/(2*dt), is the highest frequency that can be reliably measured for a given time sample rate.  In this example the time sample rate is 0.001 sec, yielding a Nyqvist of Fn=1/(2*dt)=500 Hz. However, the input signal (upper) is a 700 Hz sine wave, a full 200 Hz above Nyqvist. The Fourier amplitude spectrum (lower) shows that the 700 Hz signal frequency is wrapped, or reflected across, the Nyqvist frequency to appear as aliased energy at 300 Hz. 


Sunday, January 7, 2018

DISC Rose and Thorn

Encore repost from TUESDAY, JANUARY 8, 2013

After posting this encore, I got a request from John Stockwell to tell the 'counterfeit $ scam' story listed under Worst Incident, so here goes. It was my last day in Buenos Aires and I learned there was a street market near the hotel. I walked the market, being mindful of security and pickpocket threat which is always a possibility. Typically, I will go slowly to one side of the market then the other, pausing to glance for anyone watching, then occasionally do a full stop against a wall to scan the whole scene. These are things you pick up living and working in hazard areas around the world.

At the end of the market there were several taxis and I chose one (did not go with anyone who chose me) and we headed back to the hotel. The cab pulls up 2 blocks from my hotel and points to the meter demanding the payment in local currency, of which I had none. My plan to was to pay via the concierge at the hotel and add it to my bill. It turned into quite a fuss with me saying 'go to the hotel' and him saying 'pay here' and neither understanding much of the other's english. Finally, I pull out my wallet and show him I only have a US $100 bill, which he quickly grabs. Before I could react (10-15 seconds max) he hands it back and kicks me out of the cab, I walk to the hotel and fly back stateside that night.

Back home, our yard guy shows up needing to be paid for several visits, about $100, so I pay him cash. He is back at the house in an hour saying, 'The $100 was counterfeit, the bank took it, and the FBI may be looking for you. Oh, and you still owe me $100.' Processing this shocking news, and paying him, I thought back to the cab incident in Argentina. The cabbie must have done a quick switch of my $100 bill, pro quality stuff. When I told this whole story to my daughter Sam, she said: 'It was worth $100 just for the story.'  I tend to agree.

----- original post -----

When my son David was in the Boy Scouts, the troop would often go camping or on a high adventure hiking trip.  We had the tradition of taking a few minutes after each long day to reflect on events.  Each boy was asked to name the day's rose (best thing) and thorn (bad thing).  With so many boys in tight quarters tempers were sure to flare.  These events were often the thorns and the reflection time gave the adult leaders a chance to talk it out with the group and then follow up with all the good things that happened.

In that vein, I humbly offer this list of roses and thorns from my year as DISC instructor for 2012.


Most amazing place:       Sugar loaf mountain (Rio)
Favorite place:           Narita, Japan
Most amazing building:    Galleria (Milan)
Most amazing event:       Earthquake (Milan)
Most traffic:             Moscow 
Least traffic:            Midland
Worst passport line:      5 hours (Saudi Arabia)
Best view:                Atop Sugarloaf (Rio)
Best food in general:     New Orleans
Best meal:                Dora(Buenos Aires)
Best vege food:           Le Grenier(Paris
Cleanest city:            Narita, Brisbane
Most crowded:             London
Best castle:              Dunnotar(Aberdeen)
Least crowded:            Stavanger 
Most graffiti:            Paris 
Most expensive hotel:     Moscow 
Most expensive taxi ride: Milan
Most expensive beer:      Stavanger 
Biggest airport:          Beijing
Smallest airport:         Midland
Best airport:             Brisbane
Largest class:            110 (Calgary)
Smallest class:           5 (Copenhagen)
Hottest:                  97F/36C (Midland)
Coldest:                  38F/3C (Stavanger in June)
                          31F/-1C (Istanbul in Dec)

Best pub:         Little Creatures Brew Pub (Perth)
                  Warwick Arms (London)
Best coincidence:         
                  Antiquarian book fair (London)
Worst incident: 
                  Slide problems at DISC 1 (Brisbane)
                  Counterfeit $ scam (Buenos Aires)
                  Missed flight (Villahermosa)